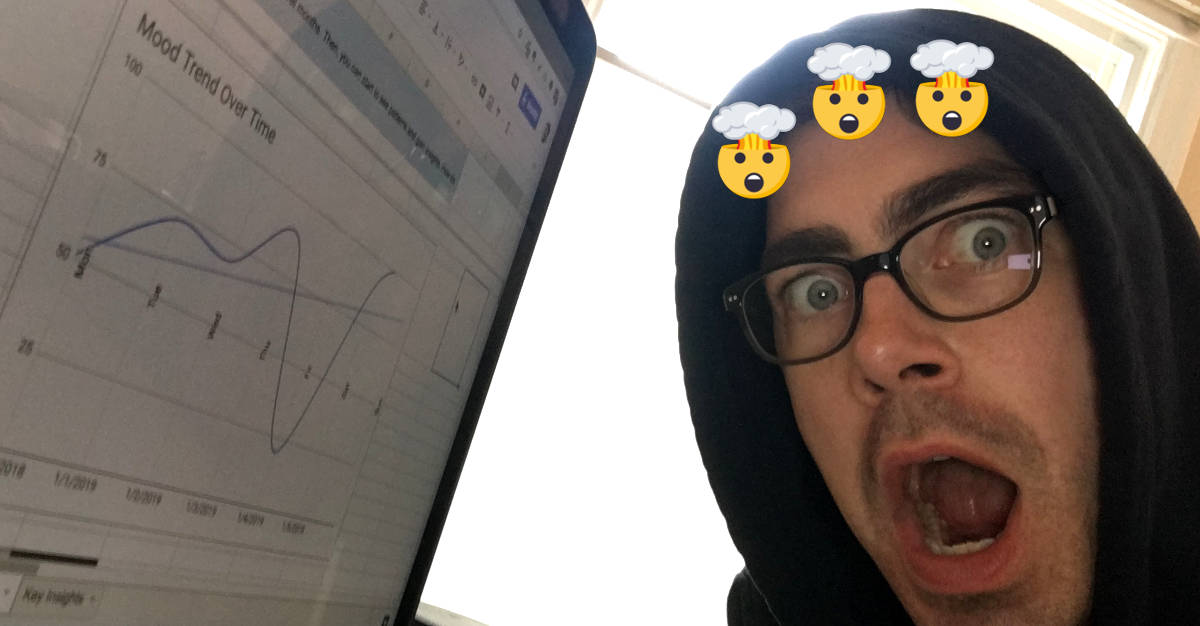
I have a confession to make. I’m a data nerd. For the last eight months, every night, I’ve kept a sort of data-driven diary, with inputs from my daily life tracked inside a spreadsheet. And I’m not alone. There’s the Quantified Self Movement, where data nerds attend meet-up groups to talk about their own self-tracking methods. The movement’s cofounder Gary Wolf explains it as “self-knowledge through self-tracking with technology.” I haven’t yet attended any of these meet-ups, but I’m sure there are people that get even nerdier with their data than I do.
Why go to all the work of tracking data on yourself?
It’s not for everyone. You need enough self-discipline to spend 5-10 minutes on data entry each evening, consistently, for a few months at minimum. But the rewards are huge once you have accumulated enough data to pull some insights. Think about studies you read in the news, such as “drinking 2-5 cups of coffee a day results in x health benefits.” I don’t care about these studies too much, if I can’t take action on their insights in my own life, and test the results. By tracking your own data, you’ll uncover real insights, such as “When I drink 2-3 cups of coffee a day, I have an improved mood + am a more productive writer/exerciser/whatever. But when I have no coffee, or I have more than 3 cups of coffee, I don’t see these benefits. So 2-3 cups of coffee is my personal sweet spot.”
Find your personal sweet spots
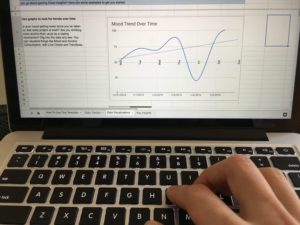
Tracking mood trends over time can help you gain valuable insights into your personal sweet spots around things like social time vs. me time that you might not otherwise recognize.
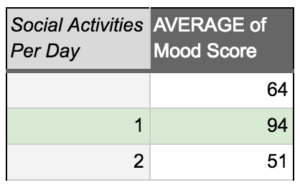
I’ve been getting better at it, but I haven’t always been the best at listening to myself, and my needs, on an emotional level. Tracking this data has help me stay connected to + listen to myself. For example, I haven’t always realized how how much / little “me time” I need. By tracking social activities, I’ve been able to find the “sweet spot” for social activities, while paying more attention to this in my day-to-day, knowing that my “sweet spot” for social time is likely to change over time and other things going on in my life.
Stay accountable to your goals + see if they are delivering the results you seek
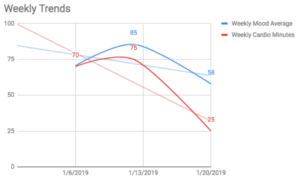
I have a goal of getting 90 minutes of cardio in each week. By tracking my cardio minutes, I can see if I’m on/off track. I can also dig into the “why” behind the goal, for example, does getting more or less cardio impact my average mood score for the week?
As another example, when I was recovering from a back injury, I tracked my injury pain, daily physical therapy exercises, and any other physical activity I did during the day. This helped me track progress to my recovery (and showed me when I pushed toward recovery too aggressively).
Why use a spreadsheet? Isn’t there an app for that?
Yes, but quantified self apps are at the very early stages of providing useful insights on your data, and don’t allow you to customize the data you want to track. I haven’t seen any apps out there yet that allow for creative minds / spreadsheet nerds like myself to dig deeper into the data. The apps that help you quantify yourself right now (ex. Gyroscope) do this by pulling in data from all your other apps (e.g. Health Tracker, Fitbit, RescueTime), adding in their own features (ex. Mood Tracking), and spitting out daily + weekly insight reports. If you’re like me, you pay attention to these reports a few times and then get bored as they lack actionable insights. You want to dig into the data your own way.
How to track your data: try my spreadsheet template
I’ve created a Google Sheet template that you can copy to your personal Google Drive (or save offline), get your Free Habit Tracking Spreadsheet.
To keep your tracking consistent, try connecting the habit of recording this data to one of your daily habits. For example, maybe you record it before you brush your teeth and go to bed. When you remind yourself “It’s time to brush my teeth”, you can also say “Oh and record my data”, so you don’t forget.
Ideas of things data to track
Here’s some of the data I track each day:
Data Fields
- Mood Score: There are plenty of apps out there that generate this, or you could create your own scale. I use Gyroscope Pro which gives me a 1-minute swipe-left/swipe-right survey, ending in a mood score of 0-100.
- Hours of Sleep: The hours of sleep I get each day. I was gathering this data using my Fitbit sleep tracker, but got tired of wearing it, so now I estimate it based on time to bed and wake-up time.
- Meditation Minutes: How much time I sit in meditation each day
- Strength Training Minutes: How much time I spend on strength training that day
- Cardio Training Minutes: How much time I spend in my ideal cardio zone each day. I use a Polar chest strap that tracks my heart rate during cardio and feeds that data to an iPhone app.
- Caffeine: How many cups of coffee/tea I have each day. I adjust the number of cups depending on volume and caffeine content (coffee is usually 2-4x the caffeine content of tea)
- Alcohol: Number of drinks I have in the day, adjusting for strength. So 1 12-oz beer would be equivalent to 1 1.5 oz shot of whiskey or a 4-5 oz glass of wine.
- Social Activities: Anything that’s above the normal social interactions for me. If I met a friend or had a date after work, this would count as one social interaction.
- Fast Hours: If I fasted during the day, how many hours I spent in the fasted state. Read my blog post about doing a 3-day fast.
- Injury Pain: If I am recovering from any sort of injury, I track the pain level here, so I can see if my recovery strategy is working (and show it to my chiropractor / physical therapist)
- Pomodoros: I usually track my writing + editing in pomodoros (25-minute increments). Read my blog post about using the Pomodoro technique.
Text Fields
- Supplement Changes: If I started/stopped taking any supplements, those would be noted here, especially ones that could have an impact on my energy levels or circadian rhythm (ex. melatonin, rhodiola, etc).
- Sleep Insights: Any details about the quality of my sleep, interesting dreams I had, and how many times I awoke during the previous night
- Interesting Insights: Overall impression + description of my activities for the day, usually in 2-3 paragraphs
How to turn the data into actionable insights
The data you’re tracking isn’t very interesting until you’ve accumulated it over the course of several months. Then, you can start to see patterns and gain insights. How do you go about gaining those insights?
Use graphs to look for trends over time
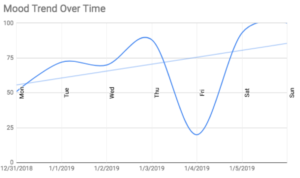
Is your mood getting lower since you’ve taken on that extra project at work? Are you drinking more alcohol than usual as a coping mechanism? Dig into the data and see. You can visualize Mood and Alcohol Consumption with Line Charts and Trendlines.
Use pivot tables to correlate your mood to other data points
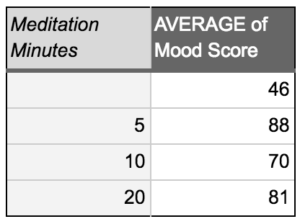
Are you happiest on Sundays? Is your mood higher on days that you meditate for 20 minutes, or 60 minutes? 2 cups of joe, or 4? Are you happier on days that you have social things going on?
Uplevel your data: Track weekly trends over time
Daily data is important to track, but there’s a high signal-to-noise ratio when you go to visualize it and search for trends. That’s why it’s also important to look at weekly trends in things like Mood and Cardio Minutes.
Identify your personal “sweet spots”
Is your mood highest when you have a social activity planned? That’s useful to know so you can plan your weeks out in a balanced way. These “sweet spots” are important to look at for both daily and weekly trends (ex. maybe 3 social activities per week is your sweet spot).
Track all of your Key Insights
After digging deep into the data, and finding some meaningful insights, it’s time to make them actionable. Put them into a separate sheet, and write out the TL;DR + details of the insight. Then, it’s up to you to test out this insight, with an open mind, knowing that your hypothesis could be wrong.
One example for me would be melatonin: I was taking it to get to sleep, but also noticed in my sleep notes that on the nights I took it, I had snoring issues and awoke more often in middle of the night. And I realized that I didn’t really need it as the body naturally produces this stuff. So I stopped taking it.
Don’t use the data to beat yourself up
The data is there to help you. For example, a low mood score isn’t a bad thing. It’s just a signal. Maybe that signal means that you need some more self-love or balance in your life. Maybe you need less “doing” and more “being” in your life. Or there could be something from your past that you need to let go of, like an old story you’ve told yourself many times that is now holding you back. Or maybe you are suffering in some way, but not listening to yourself and letting the emotions bubble up so that the energy can be resolved. Sitting in meditation and focusing on your breath can help when you notice this.
Own it: Make the spreadsheet yours
The Google Sheet template I created (get your Free Habit Tracking Spreadsheet) is just a template. It’s not your spreadsheet until you customize it to your unique needs. To make it yours, try journaling about what you’re most curious about in your own life:
- “Does that physical therapy that the doctor prescribed really help me recover from my injury?”
- “Am I happier when I meditate?”
- “How is my sleep impacted when I have more than a few drinks?”
Just staying curious and journaling about this stuff will help you figure out what data is worth tracking. So start small, keep it up, and after a few months, dig into the data. It’s fun. A bit addictive. And mysterious… Who knows what insights you’ll uncover about yourself (=
